Filtering single image super-resolution datasets with BHI
Intro
Having used and visually compared over 600 different upscaling models for my vitepress website that I created for others to do the same, I since then trained and released over 100 sisr (single image super-resolution) models myself, which are based on over 15 different architectures such as MoSR, RealPLKSR, DRCT, SPAN, DAT or ATD and their respective architecture options.
These models can be found on my github models repo, huggingface profile or on openmodeldb, and can be tried out online on this ZeroGPU Huggingface Space.
For sisr training purposes, I occasionally curated datasets, as was the earliest in August 2023 when I made a curated version of FFHQ called FaceUp for my FaceUp model series where I made use of the HyperIQA image quality metric for filtering.
In this post, I assess the influence of two dataset filtering techniques I made use of in the past for sisr model training, namely HyperIQA and IC9600 for complexity filtering.
Approach
My goal was to find a simple dataset curation workflow for datasets that in general either improve quality (model training validation metric scores) or efficiency (storage saving by reducing the quantity of images while keeping similiar validation metrics scores).
The BHI (Blockiness, HyperIQA, IC9600) filtering method is what I came up with, and here I wanted to evaluate its effectiveness or non-effectiveness by running tests and looking at their results.
My approach is as following:
- Train a sisr model on a standard dataset while generating validation metric scores which will serve as the baseline model
- Scoring that dataset with HyperIQA and IC9600
- Filtering the dataset with different thresholds with each of these two methods
- Train sisr models on each of these filtered datasets while generating validation metric scores
- Evaluate effectiveness based quantity reduction with the metric scores in comparison to the baseline model
- Derive a good threshold for each HyperIQA and IC9600 from the tests, which filtering techniques are then combined to make a curated version of the dataset based on these thresholds
- Train a sisr model using same options on that curated dataset while generating validation metric scores
- Evaluate effectiveness based on quantity reduction and its final scoring metrics vs the baseline model
DF2K Main Test
System Setup
All the tests are done on my home pc, here is my specs:
Ubuntu 20.04.6 LTS 64-bit
RTX 3060 (12 GB VRAM)
16 GiB RAM
AMD® Ryzen 5 3600 6-core processor × 12
Dataset
The dataset I chose is the DF2K dataset, which is a combination of the DIV2K and the Flicker2K dataset, often used as a standard training dataset for new sisr architectures in papers.
Moreover, when looking at the PLKSR paper, they trained all the plksr_tiny model from scratch (so no pretraining strategy used), where the model trained on DF2K reached better metric scores then the one trained on DIV2K only:

To increase I/O speed during training, the tiling strategy is applied, as suggested in the training section of the real-esrgan repo. DF2K tiled to 512x512 px results now in a training dataset of 21'387 tiles.
This tiled version of the DF2K dataset, which will be used for training the base model and which will be filtered on, can be found here. Since all the filtering will be done on this tiled dataset, which I uploaded on huggingface, all the filtered subsets used for training in this post, given the respective metric scores, are reproducible.
Edit: The BHI-filtered version of DF2K can be found here
Training
Plksr_tiny, which is a rather fast architecture option to train and scores higher metrics than SAFMN, DITN or SPAN on the paper, will be used as the architecture options for running these tests, on a 4x scale.
The low resolution (LR) counterpart for paired training will be created with created with bicubic downsampling only.
For reproducibility, I provide links to download the HR (high resolution) and LR datasets for the baseline model:
Link to DF2K Tiled HR
Link to DF2K Tiled LR
As for the training framework, for all these tests, neosr is being used, with the commit hash dc4e3742132bae2c2aa8e8d16de3a9fcec6b1a74, making use of deterministic training.
In general fp16 with a batch size of 16 and a patch size of 32 is used for model training, together with adamw with lr 1e-4 with betas [0.9,0.99] as optimizer, multisteplr as scheduler with 60k and 120k milestones, L1Loss only, and ema.
Training configs in general will be made available for reproducibility. Although there are a lot of options in the default config, these have been shortened for visual clarity by removing all the commented out options in the provided standard configs in neosr.
Validation
The DIV2K dataset, which in this case is a subset of DF2K, provides an official validation set of 100 images with their HR and corresponding LR counterparts. We will use this one for validation during training.
Validation during training will happen each 10 '000 iteration step, which will provide sufficient data while not slowing down training too much though running inference, used with the PSNR, SSIM and DISTS metrics.
The official DIV2K validation set can be downloaded here
Metrics
With each test I will provide the tensorboard graphs as a visualization of the model training with the PSNR, SSIM and DISTS validation metrics.
PSNR and SSIM is often used in papers for validation metrics. Since DISTS had been added to neosr, I get tensorboard graphs of this metric aswell.
There are currently 25 full reference (and 45 non reference) metric options available that can be used with pyiqa, which I all ran once when trying to find release candidate out of the checkpoints of a model training. On the curated model at the end of this test, I will additionally (next to psnr, ssim and dists) use the topiq_fr and AHIQ metrics, which seemed to perform well in my experience so far.
Floating-point format
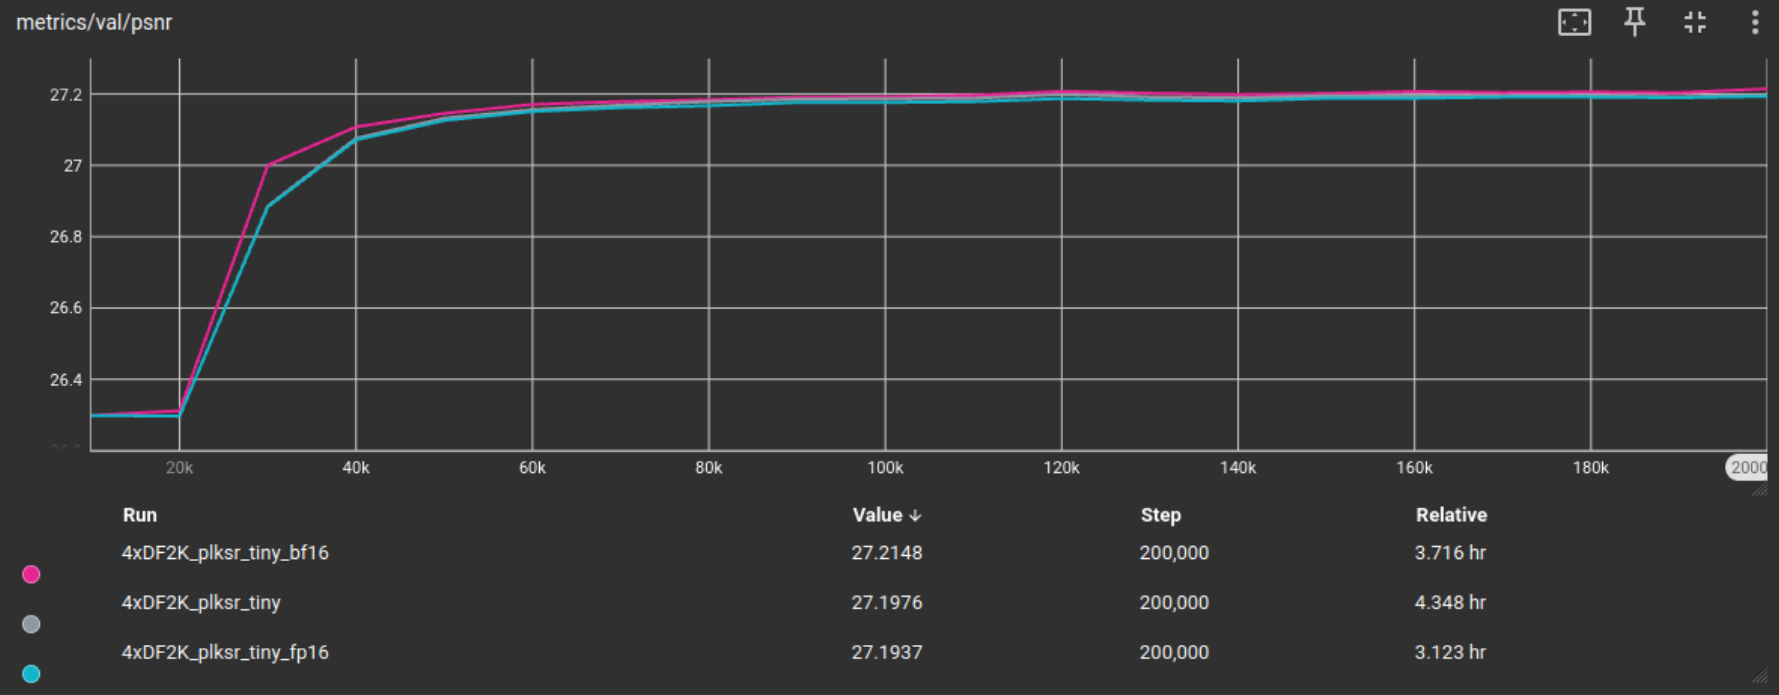
Testing the different options of using either fp32, fp16 of bf16 for training, the baseline model (on the full tiled DF2K dataset) has been trained on all of these formats for 200’000 iterations.
As can be seen in the following graphics from tensorboard, while there is little difference in validation metric scores, fp16 provided the biggest training time improvement, and will therefore henceforth be used for testing unless indicated otherwise.


The baseline models with their training configs can be found here
The BHI approach uses Blockiness, HyperIQA and IC9600 filtering for sisr training dataset curation, and I will present these filtering techniques in this order in the following sections.
Blockiness
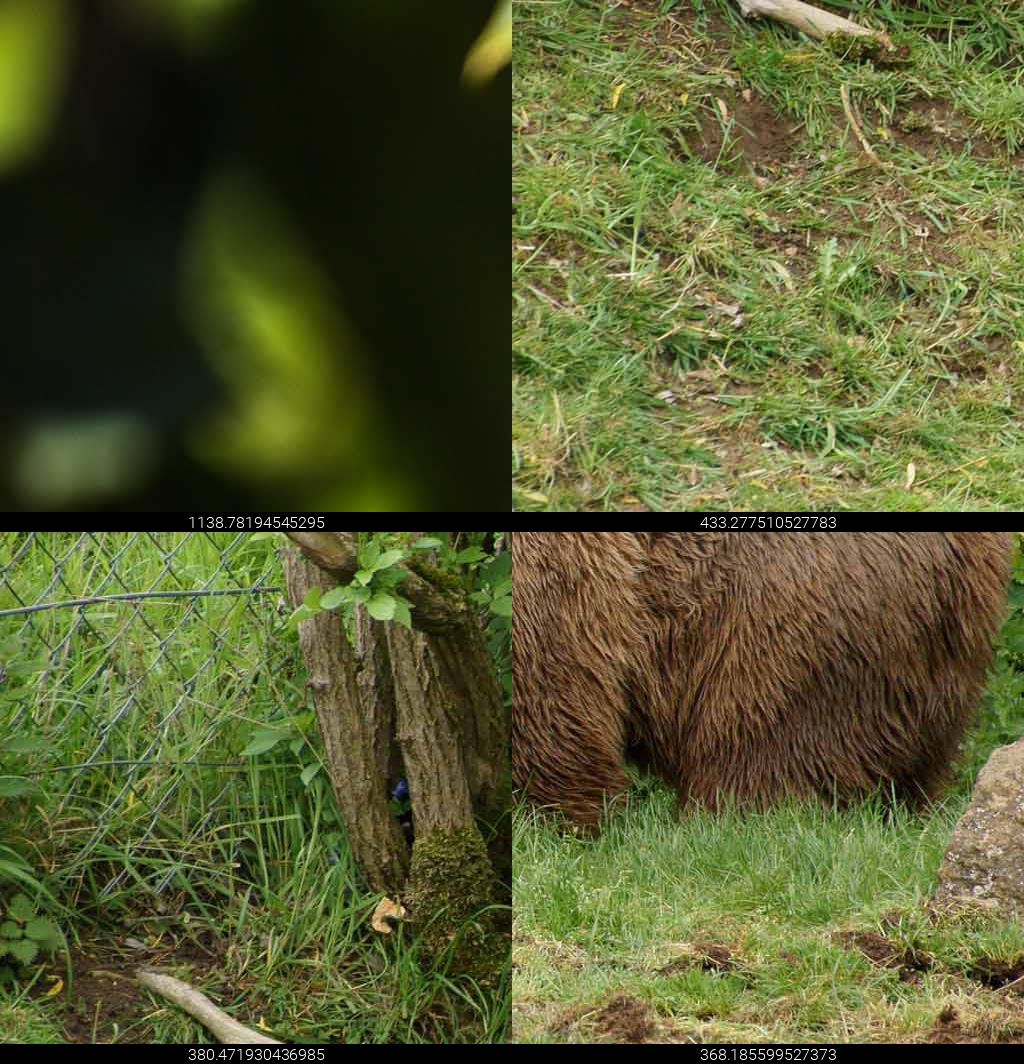
I added blockiness filtering to this curation workflow with a threshold of 30, as they have already tested and shown in the Rethinking Image Super-Resolution from Training Data Perspectives paper that not only can jpg compression within the dataset become very detrimental to the sisr training process as shown in their Figure 5 when adding jpg compression at 75% or lower to the training set, but also that in general the metric values improved with lower blockiness (except for the Manga109 test set), as shown in their Table 4. Since decreasing the blockiness threshold from 30 to 10 did not lead to an increase in validation metric scores, we use a blockiness threshold of <30 for our BHI filtering approach. These visuals are inserted here for convenience and are taken from their paper:


For visualization, the lowest and highest blockiness scoring tiles:

HyperIQA Filtering
The purpose of Image Quality Assessment is in general to evaluate the visually percieved quality of an image typically by assigning it a score. My assumption here is that IQA can be used to increase the quality of the whole training dataset, by filtering on the scored tiles through removing bad scoring tiles (which removes for example blurry and noisy tiles).
We are going to test this assumption.
For Image Quality Assessment I use HyperIQA scoring on the DF2K Tiles dataset.
I scored the tiled DF2K dataset with HyperIQA, which scores can be found in here.
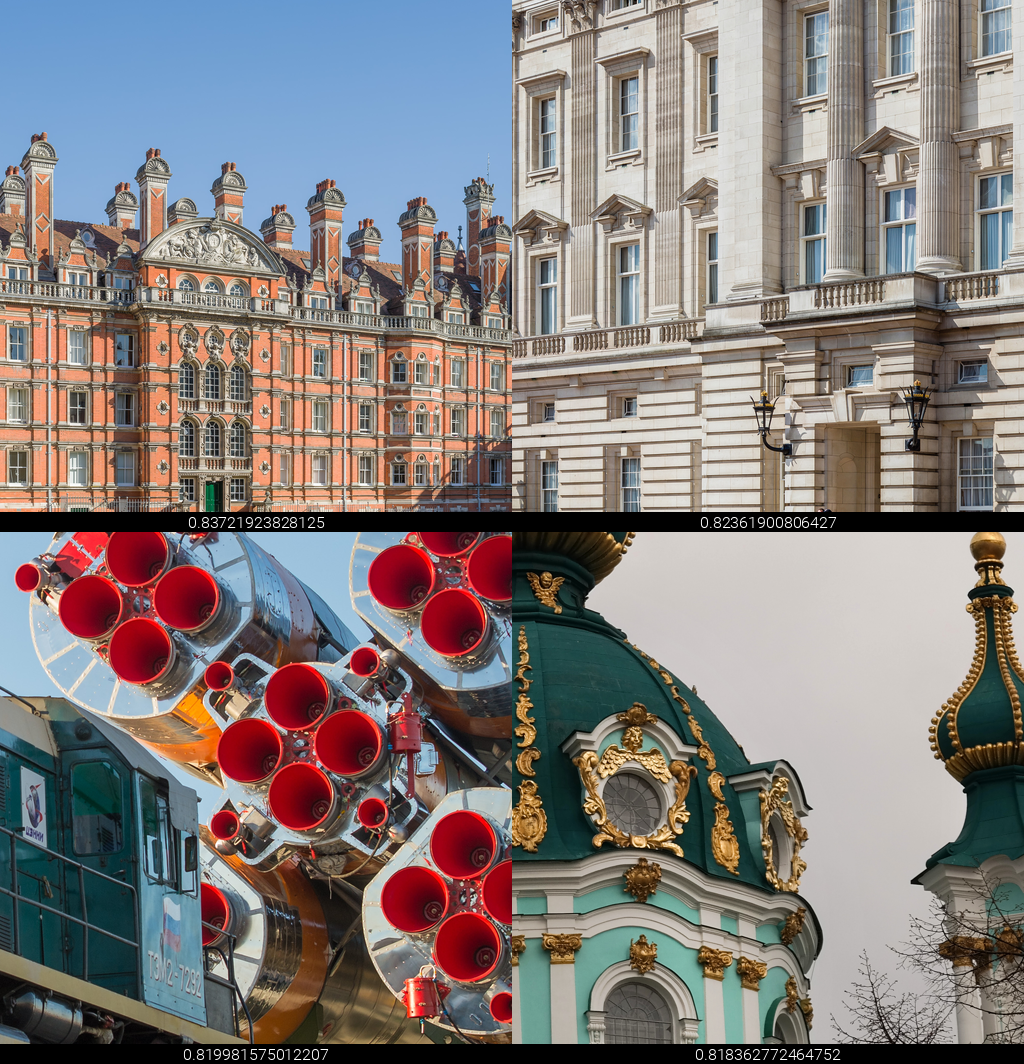
For visualization I insert here the lowest and highest HyperIQA scoring tiles:

From that scoring, I created the following filtered training subsets together with the number of tiles left plus what percent it is of the full tiled dataset:
HyperIQA score >= 0.1 -> unfiltered, full set = base model (100%)
HyperIQA score >= 0.2 -> 21’347 Tiles (99.8%)
HyperIQA score >= 0.3 -> 20’689 Tiles (96.7%)
HyperIQA score >= 0.4 -> 18’477 Tiles (86.4%)
HyperIQA score >= 0.5 -> 14’572 Tiles (68.1%)
HyperIQA score >= 0.6 -> 8’471 Tiles (39.6%)
HyperIQA score >= 0.7 -> 1’780 Tiles (8.3%)
HyperIQA score >= 0.8 -> 44 Tiles (0.2%)
Which I then trained fp16 models on for 100k iterations each, except for the 0.8 subset since there are simply too few tiles left to meaningfully train on. The results are shown in the following graphics together with the fp16 baseline model as reference point:


In all these metrics, training on the HyperIQA score >= 0.2 filtered training subset gave us superior metrics. We will use this as a threshold for our BHI filtered dataset.
What is suprising to me is that I assumed the higher the general IQA score of the dataset (meaning filtered on higher IQA score) the better the metrics would be. Looking at PSNR and SSIM this does not seem to be the case. But instead removing only the worst tiles (scoring beneath 0.2) seems to have a positive effect on training validation metrics.
I also note here that the better than the baseline model scoring models on PSNR and SSIM here still contain over 90% of the tiles from the tiled dataset, whereas with higher thresholds the number of tiles drops significantly, so the quantity of tiles might play a role in these validation metrics.
IC9600 Filtering
Another assumption is that increasing the general complexity of the dataset (increasing the amount of information that is on each training tile) would also be beneficial to sisr training or rather, for sisr training dataset curation.
For automatic image complexity assessment I use IC9600 and scored the DF2K Tiled dataset, which scores can be found in here
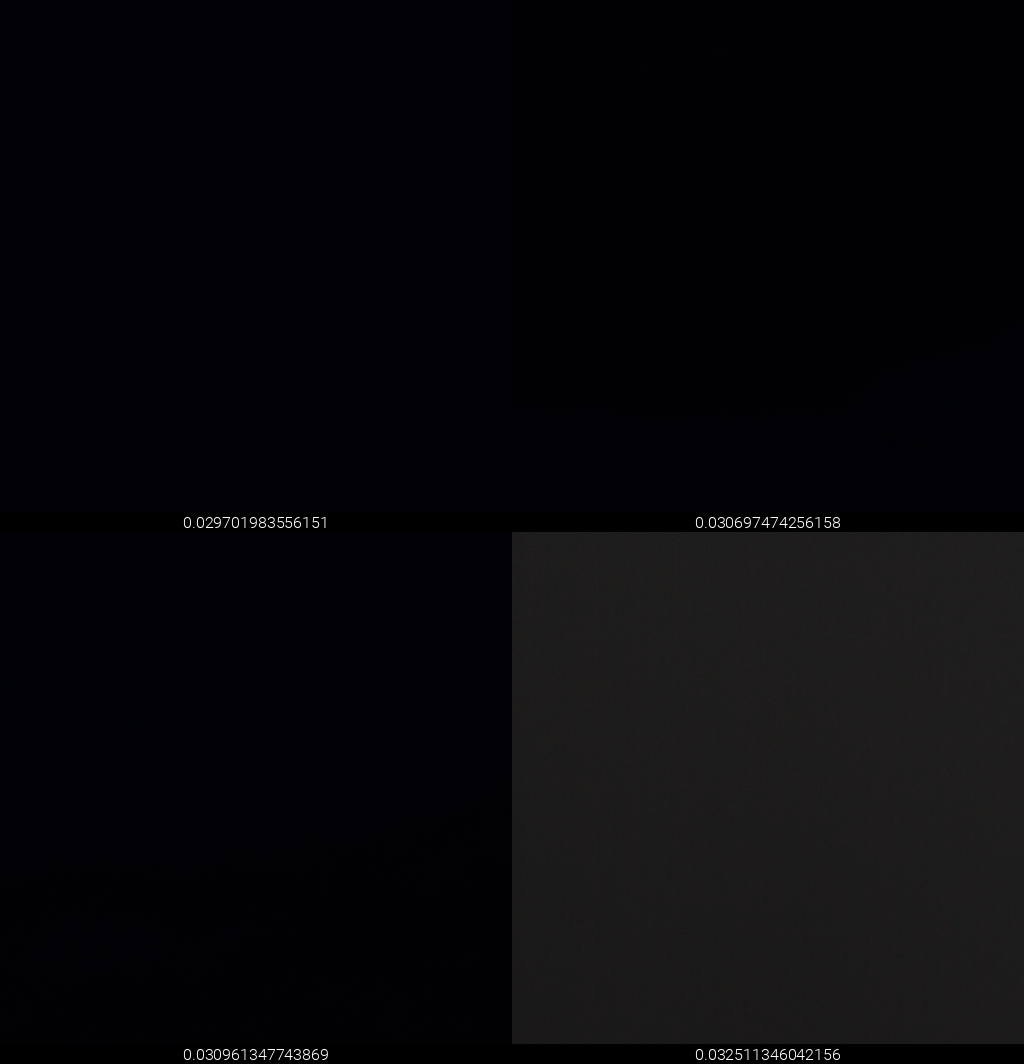
For visualization the lowest and highest IC9600 scoring tiles:

From the scoring, I created the following filtered subsets:
IC9600 score >= 0.1 -> 20’807 Tiles (97.3%)
IC9600 score >= 0.2 -> 19’552 Tiles (91.4%)
IC9600 score >= 0.3 -> 17’083 Tiles (79.9%)
IC9600 score >= 0.4 -> 12’784 Tiles (59.8%)
IC9600 score >= 0.5 -> 6’765 Tiles (31.6%)
IC9600 score >= 0.6 -> 1’918 Tiles (9.0%)
IC9600 score >= 0.7 -> 318 Tiles (1.5%)
IC9600 score >= 0.8 -> 44 Tiles (0.2%)
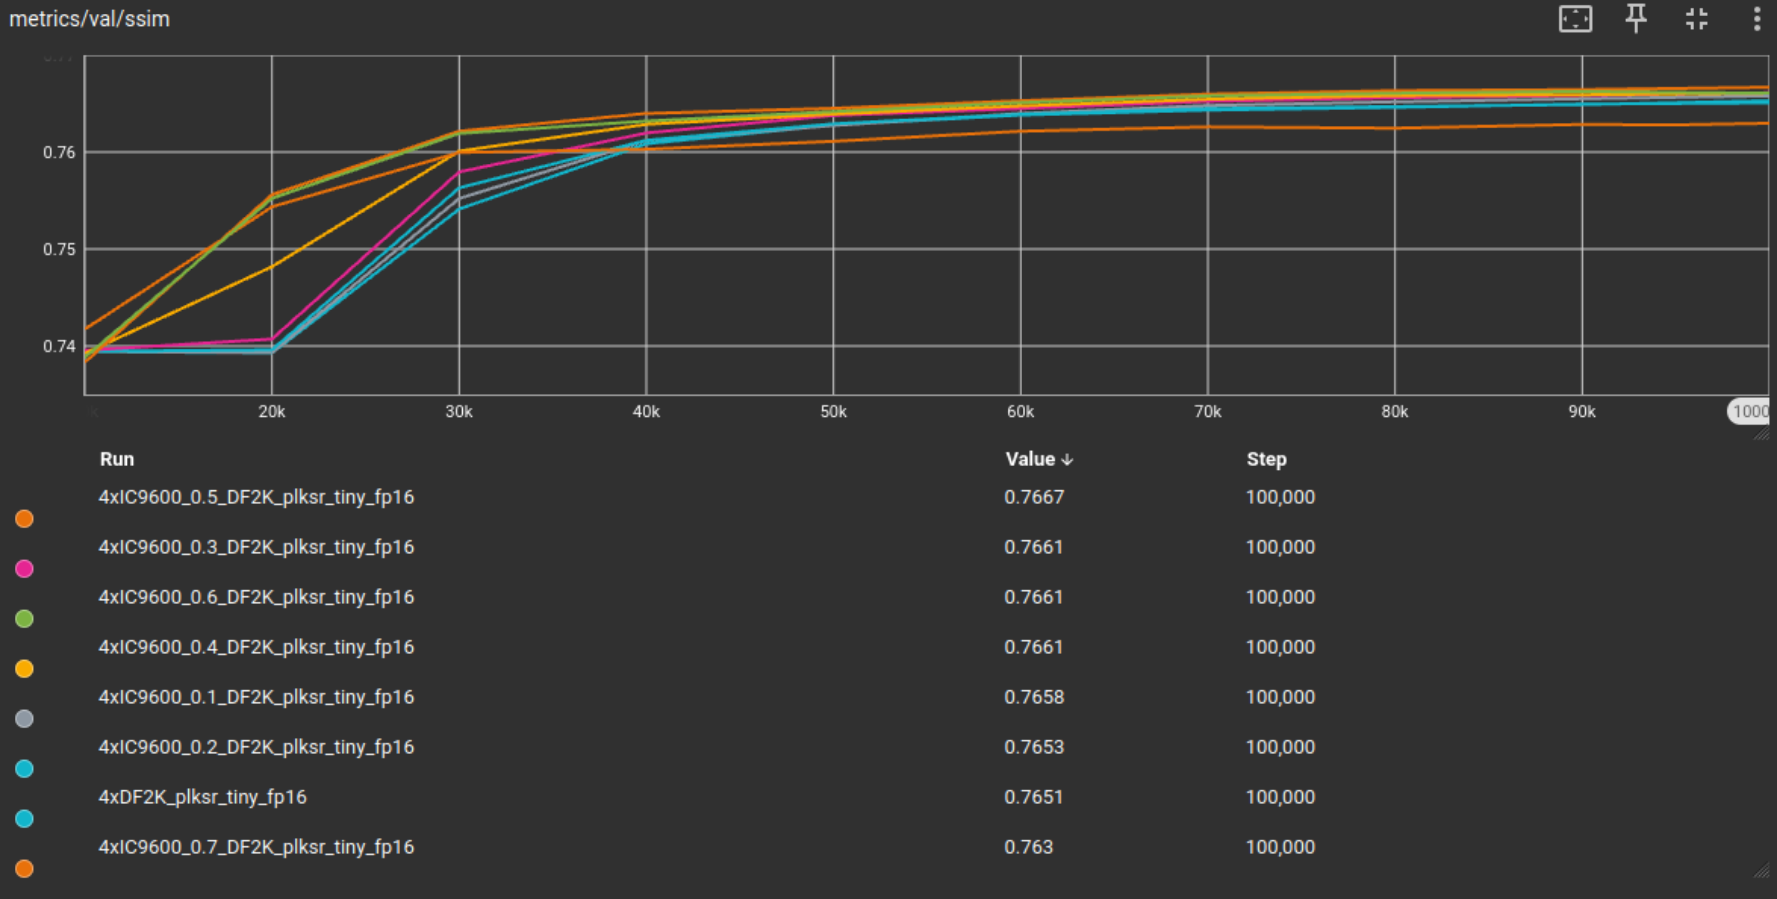
Which I then trained fp16 models on for 100k iterations each, except for the 0.8 subset since there are simply too few tiles left to meaningfully train on. The results are shown in the following graphics together with the fp16 baseline model as reference point:


Training configs and model files of this IC9600 test
From these results, IC9600 filtering seems to have a positive effect on training. Not only does the model converge faster, or reach higher metric scores in earlier iterations of training, but also to reach higher validation metrics in general. In both PSNR and SSIM the threshold of 0.5 reached highest metric values. In general this hints to a higher IC9600 threshold in general to be beneficial. The higher than 0.5 thresholds scoring worse could be because of the high reduction in tile quantity in the trainingset.
BHI Filtering
Now I combine the previous filtering methods into the BHI filtering approach using the from the previous tests established thresholds of:
Blockiness < 30 HyperIQA >= 0.2 IC9600 >= 0.5
I train a fp16 model on the now BHI filtered DF2K tiled dataset. The quantity of tiles is as follows:
Baseline DF2K model: 21’387 Tiles Curated DF2K model: 6’620 Tiles (31%)
Here are the training validation results, merged here means the combined filtering technique aka BHI filtered DF2K tiled training set:


From the results we observe that BHI filtering the DF2K tiled dataset not only led to a 69% reduction in training dataset size, but it simultaneously achieved better PSNR, SSIM and DISTS validation metric scores on the DIV2K validation set.
Though I think 100k iterations generally suffice for these tests on a lightweight network option like plksr_tiny, in the PLKSR paper they trained their plksr_tiny models from scratch up to 450k iterations. Since this is the final DF2K tiled test, I will also increase the training to 500k iterations just so I would be able to catch if something happens with longer training iterations.

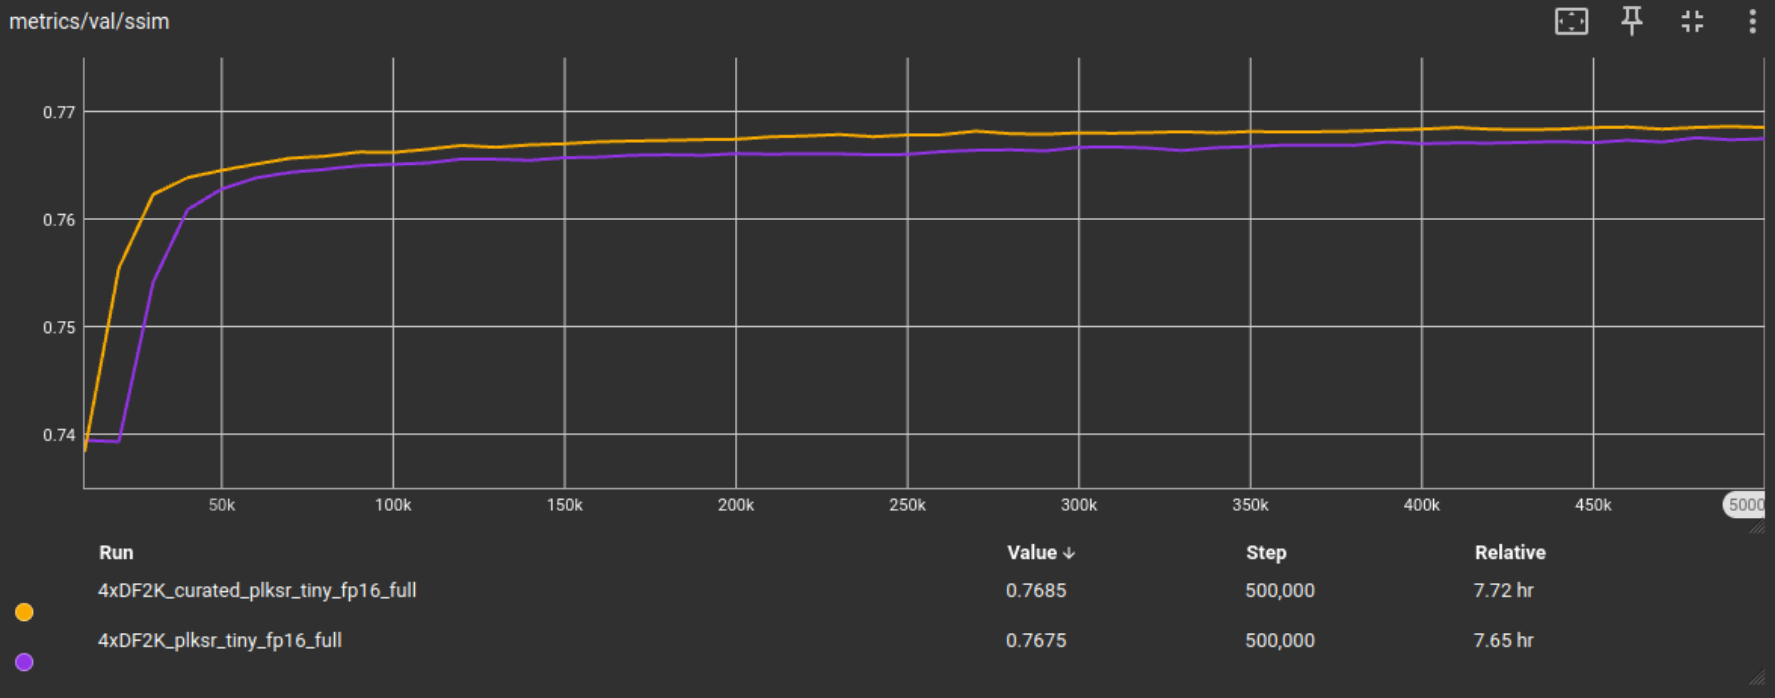

We can see that the metric scores improved and thanks to the filtering techniques like blockiness filtering, with longer iterations the metrics continuously slightly improve.
To make sure that these results are not DIV2K testset specific, I test these final models on multiple official test sets on multiple metrics. Namely the Urban100, BSD100, DIV2K and LSDIR testsets, with the PSNR, SSIM, DISTS, AHIQ and TOPIQ_FR FR (full reference) IQA metrics.

The previous evaluation still stands true even with more testsets and metrics, the model trained on the BHI filtered DF2K tiled testset was able to achieve better metric scores in general. The BHI filtering method is effective on the DF2K tiled dataset with the plksr_tiny architecture option in reducing training dataset size while achieving better metric results on multiple testing sets with multiple metrics.
By the way, as an additional quick 100k iters test, I wanted to see what happens if we change a parameter, namely the patch size, and double it from 32 to 64. In general, increasing training patch size leads to better visual model outputs.


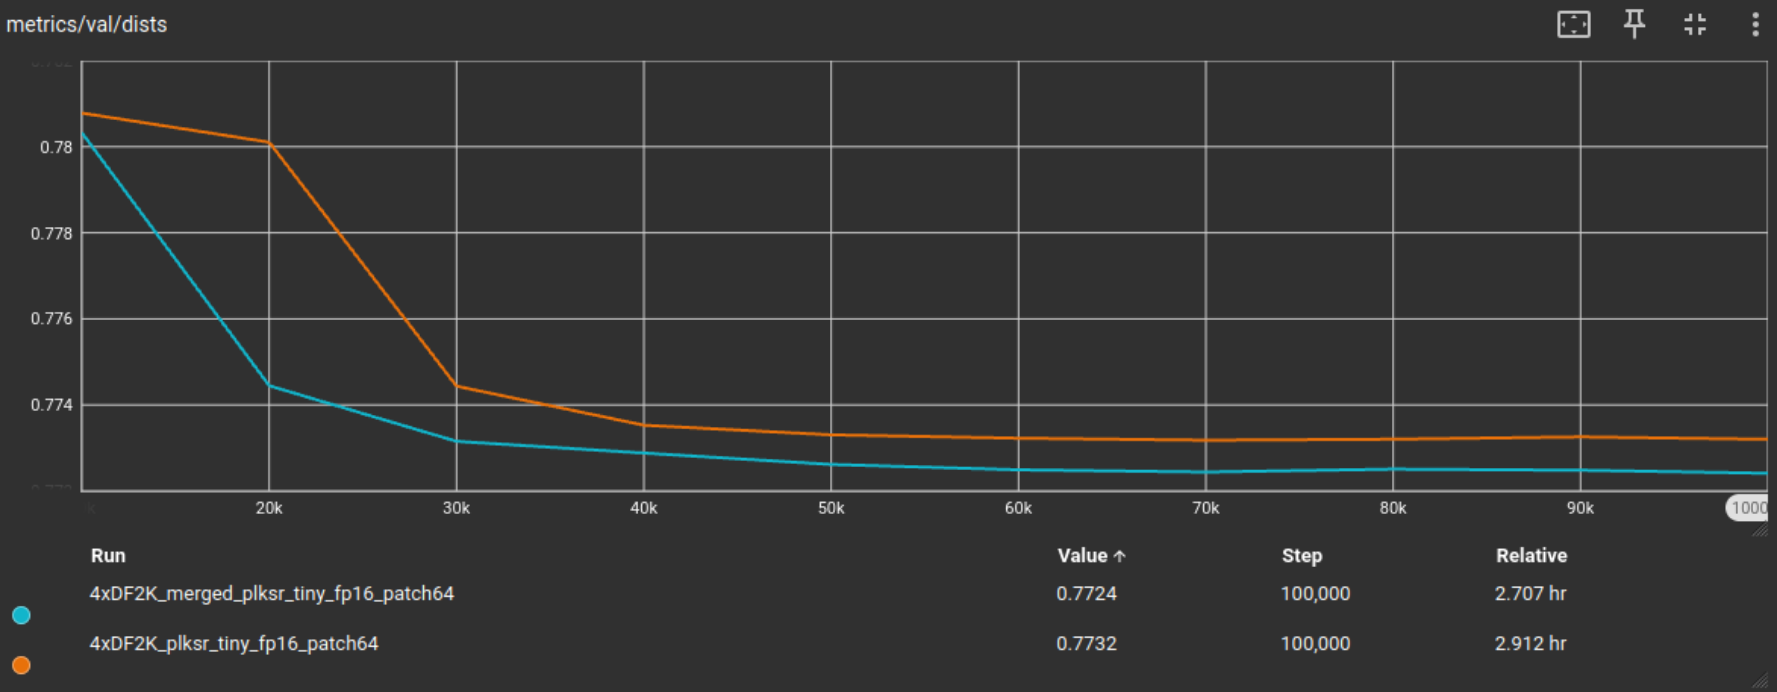
We achieve similiar results to the previous patch32 100k iters test, with slightly better metrics.
ImageNet Additional Test
To test that this is neither dataset nor architecture option specific, I repeat this filtering method with the ImageNet dataset, a dataset that is often used for the pretraining strategy in papers (like in PLKSR for the standard model).
After tiling the dataset to 512x512px, we are left with 197'436 tiles.
The corresponding LR again is created with bicubic downsampling with a 0.25 scale for a 4x model training.
Training validation is done on the Urban100 testset.
As for the architecture option, this time we use SPAN which is a bit faster than plksr_tiny and won the 1st place in CVPR 2024 NTIRE's Efficient Super-Resolution Challenge(ESR)
All the relevant files to this test are in the imagenet subfolder.
HyperIQA Filtering
As previously done, we score the ImageNet tiled dataset with HyperIQA and make subsets based on the different thresholds.
HyperIQA score >= 0.1 -> unfiltered, full set = base model (100%)
HyperIQA score >= 0.2 -> 195'500 Tiles (99.0%)
HyperIQA score >= 0.3 -> 162’991 Tiles (82.6%)
HyperIQA score >= 0.4 -> 105’809 Tiles (53.6%)
HyperIQA score >= 0.5 -> 54'819 Tiles (27.8%)
HyperIQA score >= 0.6 -> 18'397 Tiles (9.3%)
HyperIQA score >= 0.7 -> 1'592 Tiles (0.8%)
HyperIQA score >= 0.8 -> 16 Tiles (<0.1%)
Which I then trained fp16 models on for 100k iterations each, except for the 0.8 subset since there are simply too few tiles left to meaningfully train on. The results are shown in the following graphics together with the fp16 baseline model as reference point:
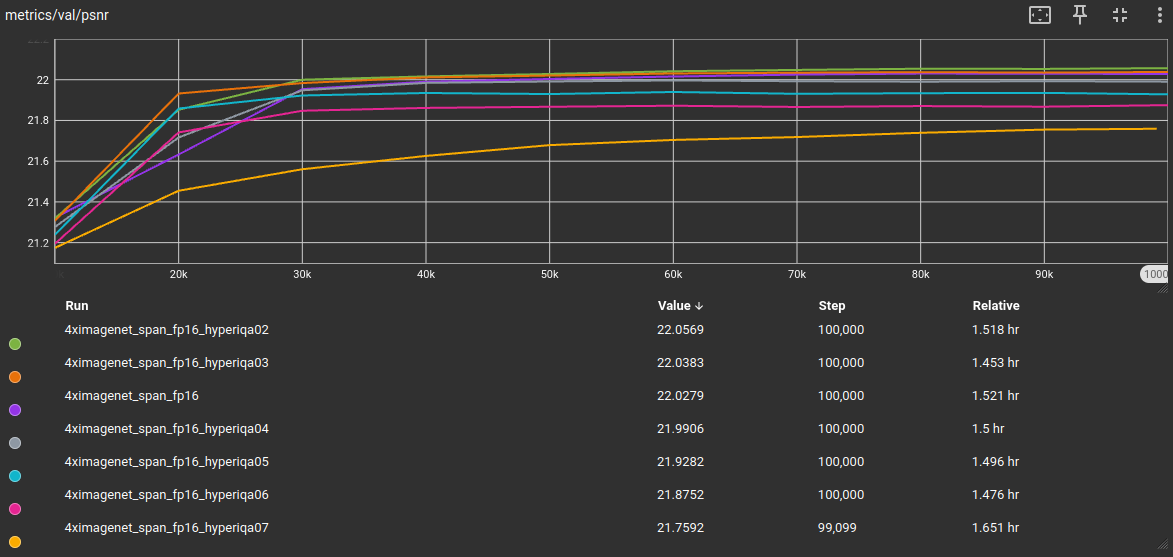


We get a similiar outcome like with the tiled DF2K dataset. Which is a good thing, since it means the previous results were neither dataset nor architecture option specific.
IC9600 Filtering
As previously done, we score the ImageNet tiled dataset with IC9600 and make subsets based on the different thresholds.
IC9600 score >= 0.1 -> 189'120 Tiles (95.8%)
IC9600 score >= 0.2 -> 166'824 Tiles (84.5%)
IC9600 score >= 0.3 -> 129'410 Tiles (65.5%)
IC9600 score >= 0.4 -> 74'987 Tiles (38.0%)
IC9600 score >= 0.5 -> 24'989 Tiles (12.7%)
IC9600 score >= 0.6 -> 3'607 Tiles (1.8%)
IC9600 score >= 0.7 -> 446 Tiles (0.2%)
IC9600 score >= 0.8 -> 49 Tiles (<0.1%)
Which I then trained fp16 models on for 100k iterations each, except for the 0.8 subset since there are simply too few tiles left to meaningfully train on. The results are shown in the following graphics together with the fp16 baseline model as reference point:


This time, the previous threshold of 0.5 reaches worse results, which again might be from the bigger decrease in quantity of training image tiles. We adjust the threshold of IC9600 filtering to 0.4 which achieved best metrics for SSIM and DISTS and second best for PSNR.
BHI Filtering
We apply the BHI filtering method to the tiled ImageNet dataset with
Blockiness < 30
HyperIQA >= 0.2
IC9600 >= 0.4
I train a fp16 model on the now BHI filtered ImageNet tiled dataset. The quantity of tiles is as follows:
Baseline ImageNet model: 197’436 Tiles
Curated ImageNet model: 4’505 Tiles (2.3%)
Here are the training validation results on the Urban100 testing set:
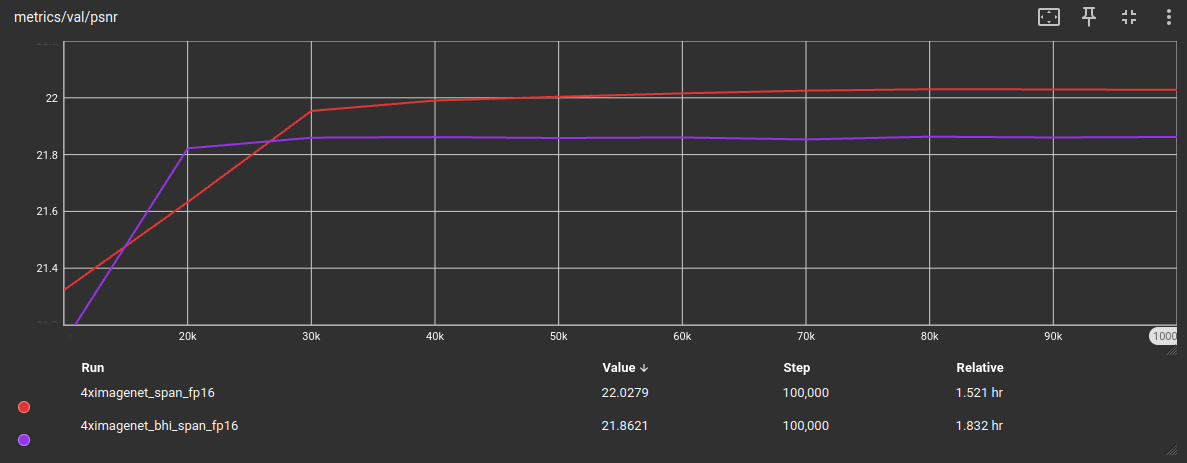


While on the DISTS metric these are close together, in PSNR and SSIM there is a wider metric gap between those two models. I assume this to be caused by the strong reduction of tile quantity in the training set (-97.71824%).
The biggest influence in this strong quantity reduction is caused by the blockiness filtering, since ImageNet is plagued by JPG artifacts. We can see the difference between these two used datasets by visualizing their blockiness distributions:


The darker blue part is the section preversed by our current blockiness filtering threshold. While in DF2K, 20'873 out of 21'387 tiles meet this criteria (97.6%), in ImageNet only 6'787 out of 197'436 tiles fulfill the criterium of having a blockiness score below 30 (3.4%).
Through the strong reduction in training tiles, training information gets lost. In such a case, we would want to reach a higher number of tiles by either merging this BHI filtered ImageNet dataset with another BHI filtered dataset, for example combining this one with the previous DF2K-BHI set. Or even better, use another, less JPG artifacts plagued dataset.
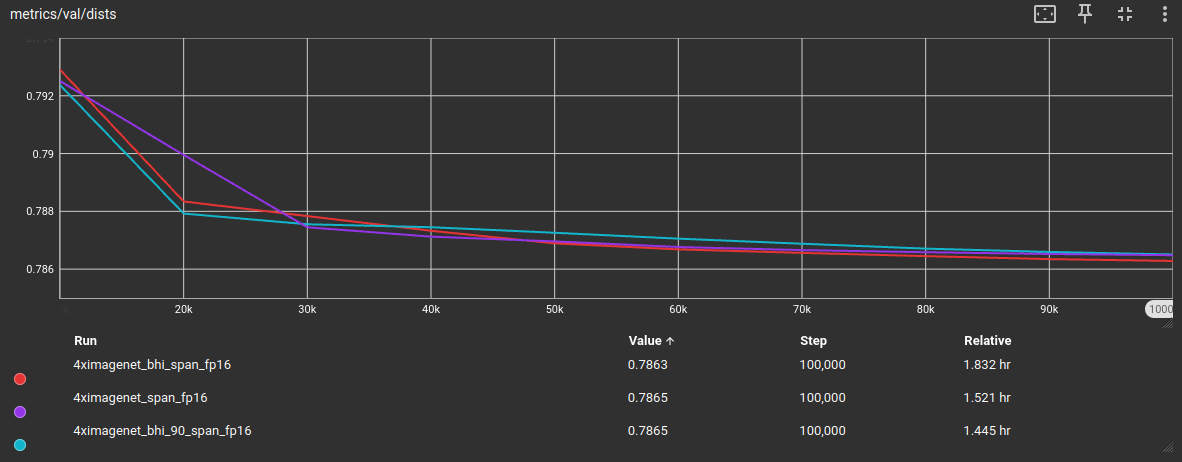
To assess if its really the reduction in training tile quantity, I increase the blockiness threshold to 90, or visually speaking, we use the dark blue, orange and yellow part now for training. This leaved us with a bigger part of the full dataset, specifically with 60'314 tiles (30.5%).
As expected, when increasing the blockiness threshold for more training tiles to survive the BHI filtering process, the validation metrics are close to the base model again, while having reduced the overall training dataset size:


Out of curiosity, since I adjusted the IC9600 threshold from >= 0.5 to >= 0.4, I wanted to test if the previous DF2K tiled dataset profits from this change. So I trained another plksr_tiny model with these adjustments, same DIV2K validation dataset for validation metrics during training:


These tests concludes that the BHI filtering method can be used to effectively curate a sisr training dataset by drastically reducing the training dataset size while keeping the validation metric scores similiar, while not being dataset nor architecture option specific.
LSDIR Quick Test
BHI Filtering
Out of curiosity, I made another test on the LSDIR dataset, but this time a quick test with only the filtered final result.
I tested the BHI filtering with the current values, and also with the old, or previous, threshold of 0.5 for IC9600, which I marked here with "0.5".
LSDIR Baseline: 179'006 tiles
LSDIR BHI: 116'141 tiles (64.9%)
LSDIR BHI 0.5: 62'192 tiles (34.7%)


From these metrics we can see that the switch to IC9600 threshold of 0.4 still holds true or gives better results than the previous 0.5 threshold. BHI filtering still is an effective way to reduce the quantity of training images while getting similiar metrics to the unfiltered dataset.
Future Work
Here I simply write possible future works I might test and/or make a huggingface community post about in the future. Its mostly ideas of things that I think could still be tested in sisr training topic:
- Creating a BHI Filtered dataset that consists of multiple merged datasets (I am working on this one currently)
- I only tested with HyperIQA, but there are other IQA NR or asthetic models out there. In a quick test I did, qalign8bit and topiq_nr filtered to the same dataset size did not preform significantly better. Still, all in pyiqa available NR metrics could be tested if one of them would be most suited (or more suited than hyperiqa) for sisr dataset curation.
- Same goes basically for IC9600, there are other complexity metrics, in the mentioned paper in the post they for example tested segmentation based filtering (by counting the quantity of segments in an image). IC9600 could be compared aganst those.
- Can rarity filtering be used for sisr training dataset curation to increase diversity like in the paper Rarity Score : A New Metric to Evaluate the Uncommonness of Synthesized Images? github rep
- Can we use clustering (like k-means) or something similiar to get information about the object distribution in the training dataset? This could then be used to maybe increase diversity (like if we recognize that only 0.1% of the dataset includes portrait photos / human faces for example)
- I only quickly tested multiscaling where it didnt really improve the result. But it could more throughly be tested if multiscaling would be beneficial or not for sisr model training.
- From my tests I got the impression that noise present in the training dataset is not having a negative impact as I would have assumed (always tried to keep my training sets noise-free). It could be tested if having noise in the training dataset does have a negative impact or not on sisr training (and of course, noisy to what degree). (Though in contrast I expect blur to have a negative impact. But this could also be tested)
- I once was working on a realistically degraded dataset, which led to my RealWebPhoto dataset, I could write a huggingface post about that
- From training experience, the default otf values as used in the Real-ESRGAN pipeline as used on their repo and then by HAT and other architectures from then on, seemed unoptimized or non-ideal, or in other words, too extreme. I once tested different values which led to the standard otf values now used in neosr. I could write a huggingface post about that aswell (and retest).
- Like in my nature dataset, I made a more filtered version with lower quantity of training tiles for lightweight architecture options. This could be tested, do lightweight architecture options (like SPAN), medium architecture options (like MAN) and heavy transformers/architecture options (like DAT) have an ideal quantity of training tiles? If yes, what is it? Or do architecture options always profit from more training information / higher quantity of training tiles (keeping complexity the same)?
- Normally there are papers about the singles losses themselves. But what about combinations of losses? What combination of losses gives what effects/results?
- Neosr mssim loss vs pixel l1 loss, other neosr specific losses (consistencyloss)?
- Which FR metrics would be best suited for sisr training validation metrics? Is it always just PSNR and SSIM? (speed and results)
- Better otf degradation pipeline than Real-ESRGAN which can also add like DX1 compression for game texture upscalers, different video compressions for video upscalers, and so forth? (integrating something like umzi's wtp_dataset_destroyer in a training software)
- I normally dont like diffusion-based upscalers much because they change the input image too much (the output is a different image, not an upscaled version of the input basically). But I do think they have strenghts. This effect can be desired if the input image is too destroyed (from degradations) for a transformer alone to restore, so additional details need to be hallucinated, which is diffusers strenght, but in a controlled manner, like i showed in my super workflow. I could make a huggingface post about that aswell.
You made it to the end of my post :D Thank you for reading :)